A R de Mesquita, C A S França & M A Corrêa
Instituto Oceanográfico da Universidade de Sao Paulo
Sao Paulo - Brazil.
Abstract
The correlation coefficient, ![]() ,
is shown to depend on the ratio of two variances and then invariant on
the inclination
,
is shown to depend on the ratio of two variances and then invariant on
the inclination ![]() of the
regression line relative to the co-ordinated axes. Also invariant with
the inclination
of the
regression line relative to the co-ordinated axes. Also invariant with
the inclination ![]() is the
mean distance l of the discrete data points to the regression straight
line.. Analysis of these coefficients (
is the
mean distance l of the discrete data points to the regression straight
line.. Analysis of these coefficients ( ![]() and l ) and their invariance with rotation of the Cartesian co-ordinate
system, from synthetic series, allowed the definition of a variable F
=
and l ) and their invariance with rotation of the Cartesian co-ordinate
system, from synthetic series, allowed the definition of a variable F
= ![]() x l, that is also
invariant and may be taken as a constant which characterises each of the
constrained planetary series and, in consequence, the F distribution of
the entire set of PSMSL sea level series.
x l, that is also
invariant and may be taken as a constant which characterises each of the
constrained planetary series and, in consequence, the F distribution of
the entire set of PSMSL sea level series.
Trends, Regression and Distances
This communication explores relationships between parameters of time
series data, such as trends, ![]() angles
angles ![]() ,
, ![]() = tan(
= tan(![]() ) , distances l
of data points to the regression line, Fig 1, and correlations
) , distances l
of data points to the regression line, Fig 1, and correlations ![]() ,
with the aim of better understanding the geophysical information in a set
of PSMSL ( Permanent Service for the Mean Sea Level) of IAPSO, ( International
Association for the Physical Sciences of the Oceans)) sea level series
(Spencer & Woodworth, 1993), evenly distributed around the oceans,
taken here as a planetary data set. These series take values of trend
,
with the aim of better understanding the geophysical information in a set
of PSMSL ( Permanent Service for the Mean Sea Level) of IAPSO, ( International
Association for the Physical Sciences of the Oceans)) sea level series
(Spencer & Woodworth, 1993), evenly distributed around the oceans,
taken here as a planetary data set. These series take values of trend ![]() ,
that appear to be physically constrained by the planet Earth, relative
to its surface, to maximum values, say ,within
,
that appear to be physically constrained by the planet Earth, relative
to its surface, to maximum values, say ,within ![]() 1.1 radians, as the planet, in the scale of years, does not change its
volume, or shape abruptly.
1.1 radians, as the planet, in the scale of years, does not change its
volume, or shape abruptly.

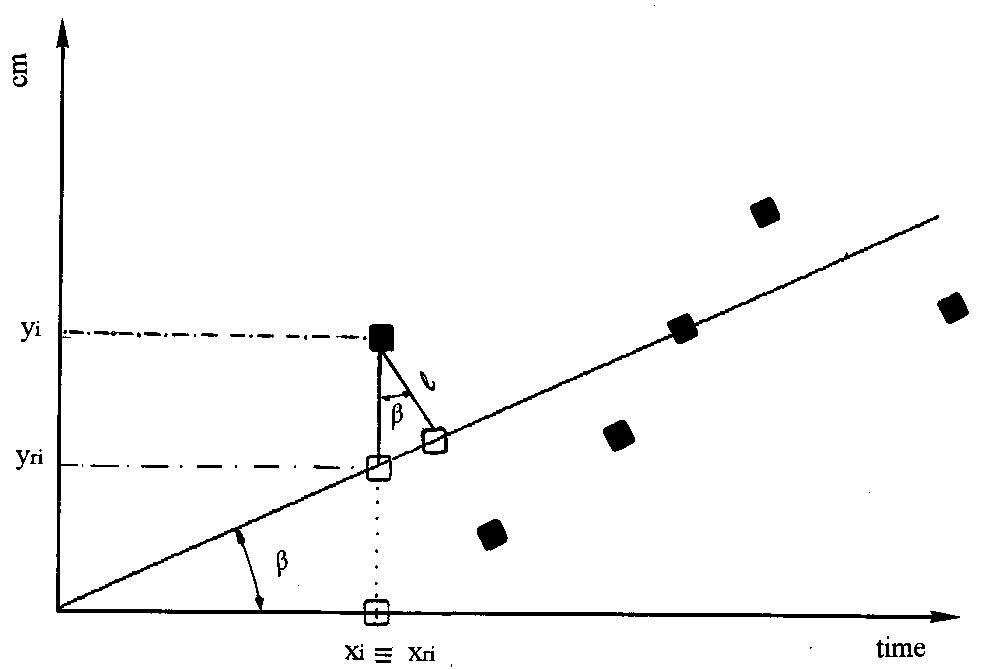
Fig. 1 - The regression line and its generating points (black spots).
l
is the distance of the point X(xi, yi), i=1,...,n,
to the straight line. Its projection on the straight line X(xri,
yri) is represented by a white square ![]() is the inclination of the straight line relative to the x axis.
is the inclination of the straight line relative to the x axis.
Free from these constraints 5,500 noisy ordinary time series, with 5
to 60 equivalent years lengths, were built, forced to acquire ![]() values within about
values within about ![]() 40,
and from them, the distances l, (the proximity of the data points
to the straight line) and also the correlation coefficients
40,
and from them, the distances l, (the proximity of the data points
to the straight line) and also the correlation coefficients ![]() ,
(the collinearity of the data points along the straight line) were calculated
. Similarly, the distance l, in mm, the correlation coefficients
,
(the collinearity of the data points along the straight line) were calculated
. Similarly, the distance l, in mm, the correlation coefficients ![]() ,
and, the corresponding trends
,
and, the corresponding trends ![]() ,
in mm/year, from real mean annual values of 837 planetary series, with
different lengths, greater than 5 years, were calculated .
,
in mm/year, from real mean annual values of 837 planetary series, with
different lengths, greater than 5 years, were calculated .
Collinearity and Proximity
The expressions usually utilised to express the data points were the
distance l = (y(ti) - yri(ti))cos(![]() ),
Fig 1, in terms of
),
Fig 1, in terms of ![]() and
the Cartesian axes, the expressions of
and
the Cartesian axes, the expressions of ![]() in terms of the covariance (COV) of the points on the regression line (
yri(ti) =
in terms of the covariance (COV) of the points on the regression line (
yri(ti) = ![]() ti +
ti + ![]() ), and
the actual data points y(ti), divided by the variance
), and
the actual data points y(ti), divided by the variance ![]() (yri(ti))
and also the collinearity coefficient
(yri(ti))
and also the collinearity coefficient ![]() ,
expressed in terms of the same covariance (COV), divided by the product
of the standard deviations of
,
expressed in terms of the same covariance (COV), divided by the product
of the standard deviations of ![]() (yri(ti))
and
(yri(ti))
and ![]() (y(ti)),
i = 1,2,3,.......,n. (n = number of points of each series). The ratio of
these standard deviations is shown to be a constant independent of the
trends
(y(ti)),
i = 1,2,3,.......,n. (n = number of points of each series). The ratio of
these standard deviations is shown to be a constant independent of the
trends ![]() as also are the
distances l of the geometrical points to the regression line, i.e.
their proximity to the line.
as also are the
distances l of the geometrical points to the regression line, i.e.
their proximity to the line.
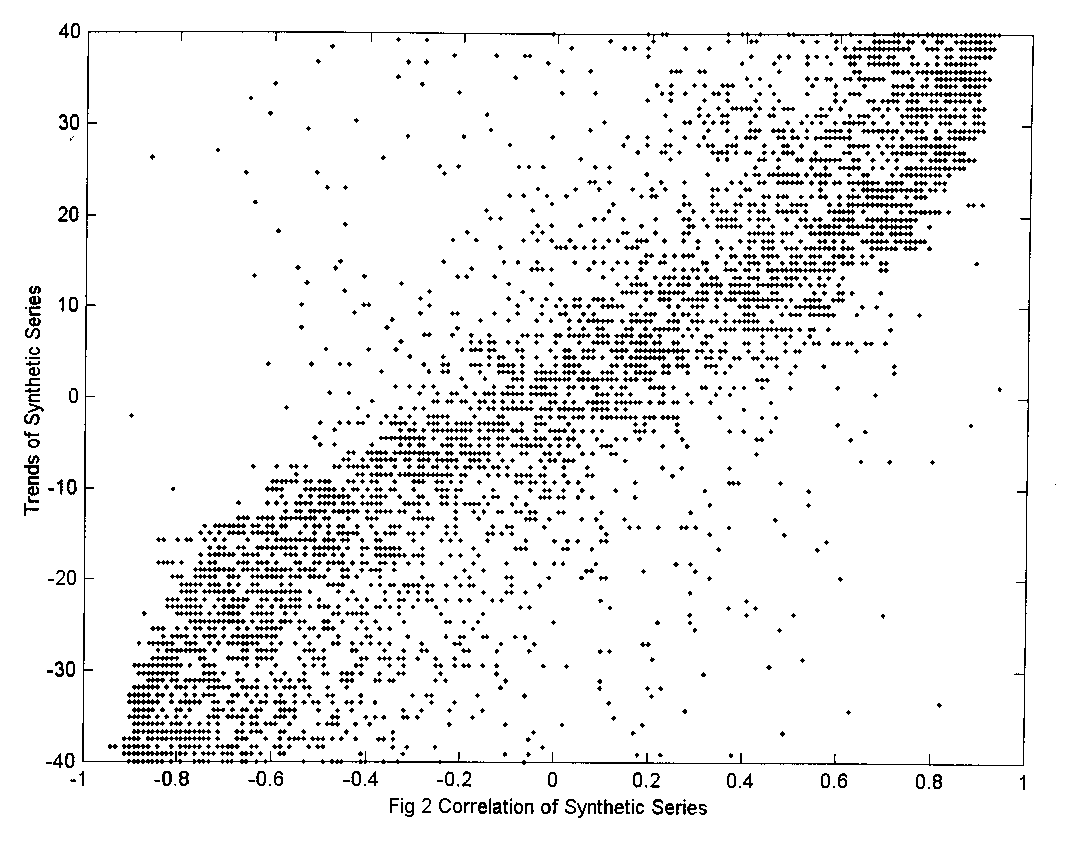
Results show that, while for the synthetic series collinearity ![]() is independent of the values of the
is independent of the values of the ![]() as shown in Fig 2, the whole set of real series have values
as shown in Fig 2, the whole set of real series have values ![]() that seem to be dependent of the trend
that seem to be dependent of the trend ![]() .
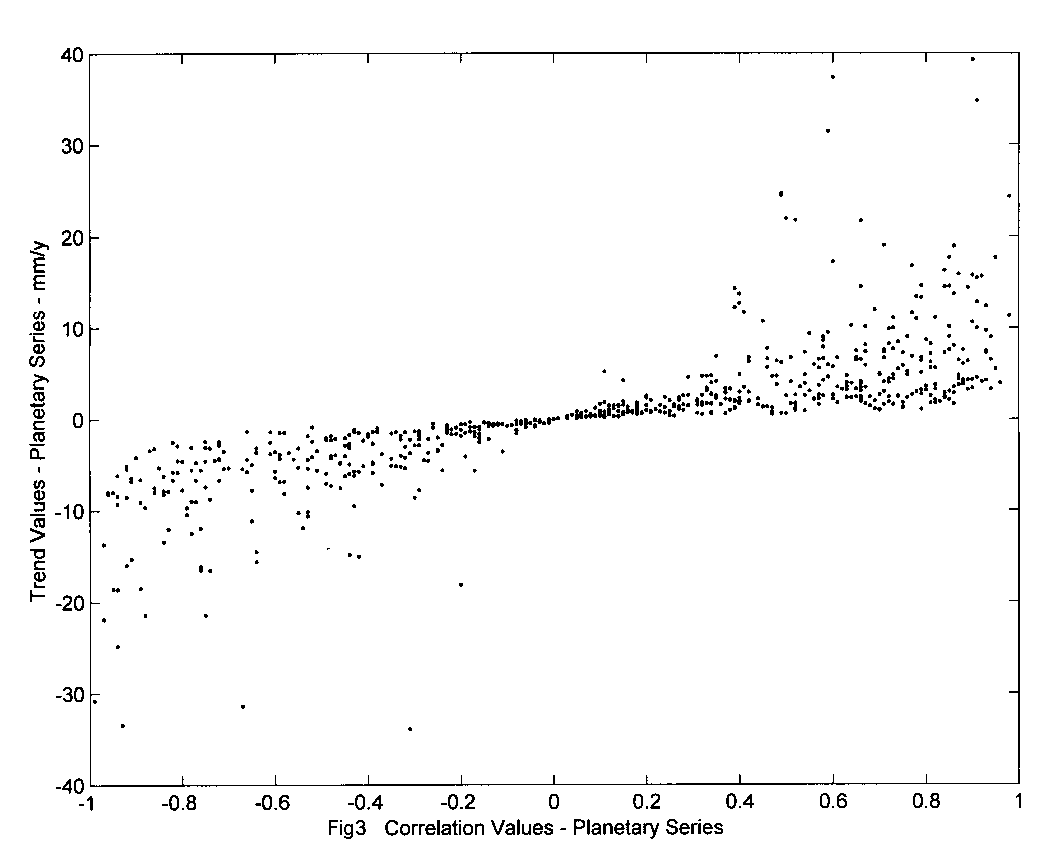
The plot of
.
The plot of ![]() x
x![]() for PSMSL series, Fig 3, revealed a linear dependence, that should have
not followed either
for PSMSL series, Fig 3, revealed a linear dependence, that should have
not followed either ![]() or
or![]() , as in fact they seem to be doing. This is interpreted as the unveiling
of an Earth's action, that is imposed on the set of PSMSL planetary sea
level series that is not seen from an individual series and requires the
whole set of series to be detected and measured.
, as in fact they seem to be doing. This is interpreted as the unveiling
of an Earth's action, that is imposed on the set of PSMSL planetary sea
level series that is not seen from an individual series and requires the
whole set of series to be detected and measured.


The F Distribution
As l, the distances (mm) and and ![]() the correlation for a given planetary series, are both independent of the
trend
the correlation for a given planetary series, are both independent of the
trend ![]() (mm/year), a function
F
= l x
(mm/year), a function
F
= l x ![]() (mm) is defined,
that is independent of the equivalent
(mm) is defined,
that is independent of the equivalent ![]() ,
which is, apparentely , also another characteristic of mass and gravity
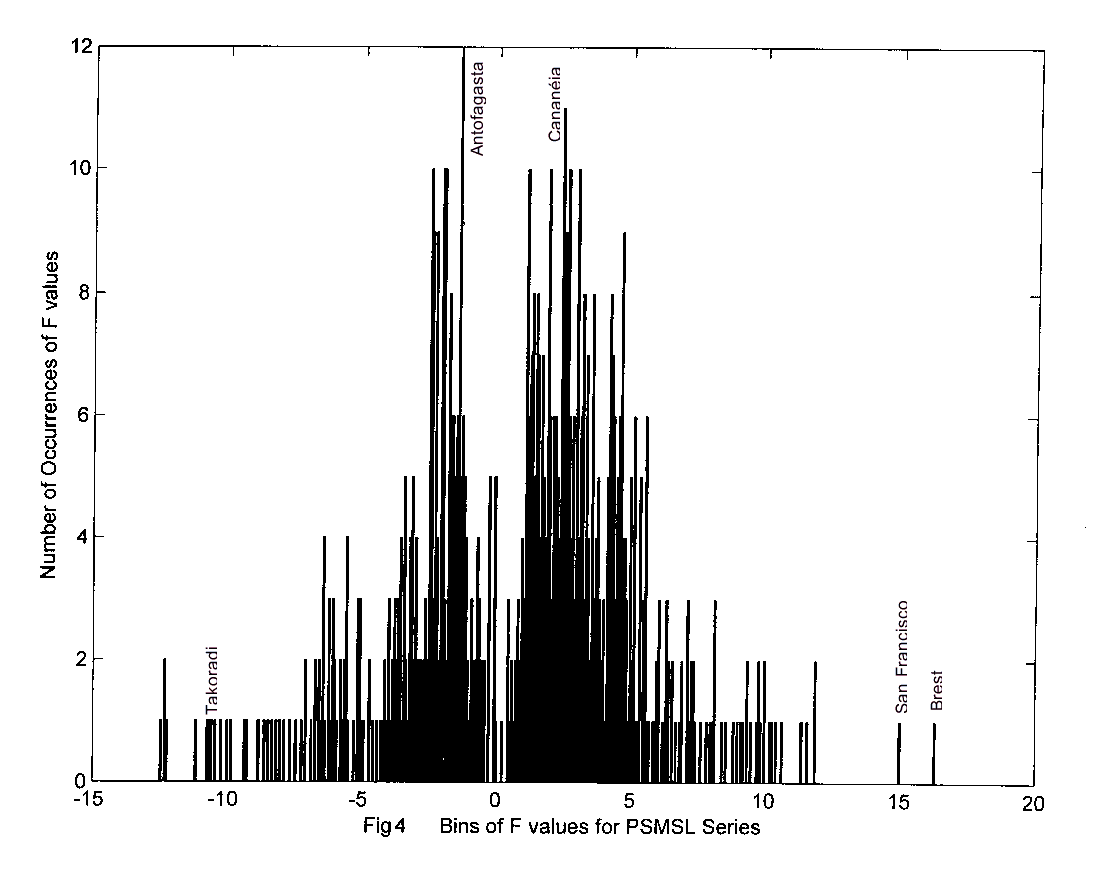
planetary series. The distribution curve of F may have, with the
glaciations, an evolving timely constant shape, that is a characteristic
of the Planet Earth, where in Fig 4, few identified ports of Africa, Europe
and the Americas, should hold in the present days, relatively permanent
positions as Takoradi, F = -11.14 mm; San Francisco, F = 14.95 mm; Balboa,
F = 8.77 mm; Antofagasta, F = - 3.35 mm ; Cananeia, F = 4.56 mm and others.
,
which is, apparentely , also another characteristic of mass and gravity
planetary series. The distribution curve of F may have, with the
glaciations, an evolving timely constant shape, that is a characteristic
of the Planet Earth, where in Fig 4, few identified ports of Africa, Europe
and the Americas, should hold in the present days, relatively permanent
positions as Takoradi, F = -11.14 mm; San Francisco, F = 14.95 mm; Balboa,
F = 8.77 mm; Antofagasta, F = - 3.35 mm ; Cananeia, F = 4.56 mm and others.

Concluding Remarks
The correlation coefficient ![]() ,
taken as a measure of collinearity, and the mean distance l, taken
as a measure of proximity of the discrete data points to the regression
straight line, in time series, are both invariant on the inclination
,
taken as a measure of collinearity, and the mean distance l, taken
as a measure of proximity of the discrete data points to the regression
straight line, in time series, are both invariant on the inclination ![]() of the regression line relative to the co-ordinated axes and in consequence
their product.
of the regression line relative to the co-ordinated axes and in consequence
their product.
The invariance of F = ![]() x
l
values (mm) means that they are not dependent of trends
x
l
values (mm) means that they are not dependent of trends ![]() (mm/year) for each series. This causes the distribution of F values
also to be independent of
(mm/year) for each series. This causes the distribution of F values
also to be independent of ![]() ,
which may be useful to examine aspects of the planet Earth that only arise
from the study of world wide, evenly distributed planetary time series,
as the set of PSMSL data.
,
which may be useful to examine aspects of the planet Earth that only arise
from the study of world wide, evenly distributed planetary time series,
as the set of PSMSL data.
Acknowledgements
We are grateful to Dr Philip Woodworth , Dr Ian Vassie and Robert and Elaine Spencer of POL (Proudman Oceanographic Laboratory), Liverpool, UK.
References
Jenkins, G M & Watts, D G , 1968 . Spectral Analysis and its Applications. Holden Day, London..523 p..
Spencer E N & Woodworth P L. 1993. Data Holdings of the Permanent Service for the Mean Sea Level. Bidston . Birkenhead. Merseyside, L437RA, UK. 81p.