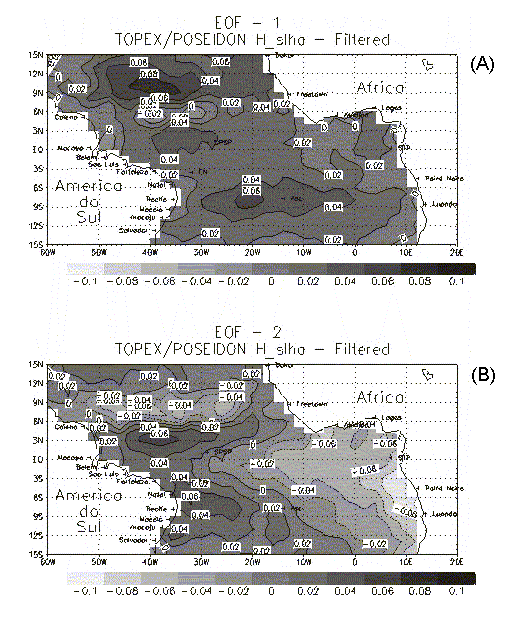
Fig.1. Spatial structures for the two most significant EOF of the low pass filtered T/P SLA in the tropical Atlantic ocean for the period October/92 to March/98. (A) EOF-1. (B) EOF-2.}
Carlos A. de S. França & Afranio R. de Mesquita
Institute of Oceanography
University of São Paulo, Brazil
1. Introduction
The interannual signal of the tropical Atlantic Sea Surface Temperature
(SST) measurements (Servain, 1998) presents two principal scales of variability:
decadal, with a north-south dipole pattern, and an interannual 2 to 5 years
east-west equatorially concentrated ``Warm Event'' pattern (Carton et al.,
1996; Servain et al., 1998).
The TOPEX/POSEIDON (T/P) altimetry data with its unprecedent accuracy
and measurement period allows inferences on the interannual variability
of sea level over the open ocean. More than 5 years of T/P altimetry
data are analysed in the tropical Atlantic ocean (15oN-15oS; 060oW-020oE)
through Empirical Orthogonal Functions (EOF) of the Sea Level Anomalies
(SLA).
2. Data
SLA for the period October/92 to March/98 were obtained from MGDRs-C
T/P altimetry (AVISO, 1996a,b). Standard corrections were applied to the
data and summarised in Table 1. Ellipsoidal sea level were resampled to
a 30 km alongtrack intervals and time series were formed. Elastic Ocean
Tide were removed by harmonic filtering 11 tidal constituents (Table 1)
and SLA were estimated relative to October/92 to October/96 (4 years) mean
value of the ellipsoidal sea level. Uncertainty of SLA is 4 to 5
cm for each individual estimate (Fu et al., 1994). Alongtrack SLA
were mapped into a regular 1o ? 1o grid at 10.14 days intervals through
Optimal Linear Interpolation (Liebelt, 1967), using decorrelation scales
of 150 km for space and 15 days for time. Error estimates for the maps
from Optimal Linear Interpolation (OLI) are between 1 to 2 cm in deep ocean,
but may reach more than 5 cm over the shelf and coastal borders.
The mapped time sequences were low-pass filtered to remove seasonal
and shorter periods variability by a running-mean filter with 37 time intervals
length (375 days). Filtered maps were submitted to Empirical Orthogonal
Function (EOF) analysis (Preisendorfer, 1988).
3. Results
The two most significant EOF explain altogether about 94% of the SLA
variability of the region (70% for EOF-1 and 24% for EOF-2). Spatial structures
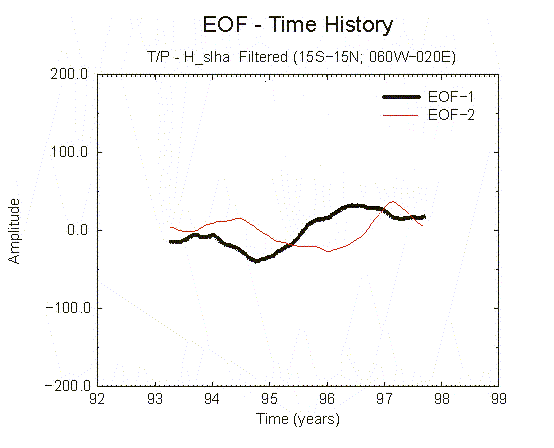
of these EOFs are presented in the Figure 1. Their correspondent Principal
Components (or Time History) are shown in Figure 2. EOF-1 presents some
structure but it is mainly positive in the region; only a zonal stripe
around 6-7o N presents negative values. The Time History of EOF-1
shows an oscillation with a period of 2 to 4 years and an apparent positive
trend. EOF-2 presents a variability concentrated around the equator
with opposing phases between Western and Eastern Atlantic. EOF-2 Time History
also shows an oscillation with a 2 to 4 years period, but clearly presents
an anomaly starting at the end of 1997 with a shorter time scale (1-2 years).
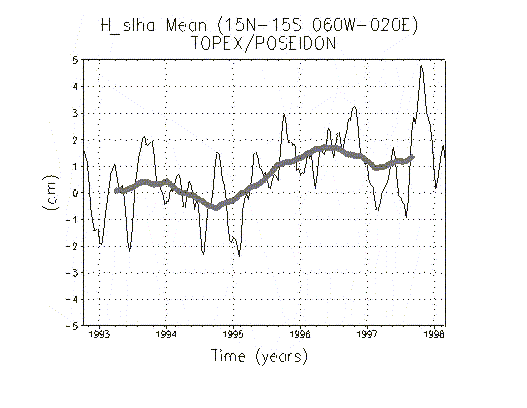
SLA mean for the region ( 15o N-15o S; 060o W-020o W ) and its low-pass
(375 days) filtered values are displayed in the Figure 3. Coherence between
the filtered mean SLA for the area and the EOF-1 Time History is
apparent. The trend estimated for the filtered and unfiltered (longer time
series) SLA mean in the area is 0.39 ? 0.06 cm/year and 0.30 ? 0.06
cm/year respectively. Variability with time scales of 100 to 150 days present
in the SLA unfiltered mean is an important contributor to the variance
of this time series.
| TOPEX | POSEIDON | |
| Orbit | CNES ELFE/JGM3 | CNES ELFE/JGM3 |
| Ionosphere | NRA - 2 frequencies | DORIS |
| Dry Troposphere | ECMWF Model | ECMWF Model |
| Wet Troposphere | TMR | TMR |
| Sea State | BM4 | BM4 |
| Pole Tide | Wahr | Wahr |
| Solid Earth Tide | CT&CE | CT&CE |
| Inverted Barometer | ECMWF Model | ECMWF Model |
| Elastic Ocean Tide | 11 const. Filter | 11 const. Filter |
CNES ELFE/JGM3 - Centre Nationele d'Etudes Spatiales (CNES) orbit estimation
NRA - NASA (National Aeronautics and Space Administration)
Radar Altimeter based correction
DORIS - Doppler Orbitography Integrated by Satellite based correction
ECMWF - European Centre for Medium Range Weather Forecast model for
atmospheric pressure
TMR - TOPEX Microwave Radiometer based correction
BM4 - Polynomial model for sea state bias
Wahr - Wahr pole motion model.
CT & CE - Cartwright & Tayler and Cartwright & Edden tidal
potential model.
11 const. filter - Mm , Mf , Q1 , O1 , P1 ,
K1 , N2 , ?2 , M2 , S2 , K2 .

Fig.1. Spatial structures for the two most significant EOF of the low
pass filtered T/P SLA in the tropical Atlantic ocean for the period October/92
to March/98. (A) EOF-1. (B) EOF-2.}

Fig. 2. Time History of the two most significant EOFs in the region
060o W - 020o E , 15o N - 15o S , for the period October/92
to March/98.

Fig. 3. Mean value and low pass filtered mean value of the T/P SLA
in the tropical Atlantic ocean area for the period October/92 to March/98.}
4. Discussion
The anomaly occurring at the end of 1997 observed in the second EOF of the T/P SLA in the tropical Atlantic ocean seems to fit to a “Warm Event” (Carton & Huang, 1994), similar to “El Niño” phenomena occurring in the tropical Pacific ocean. During boreal winter 1996-1997 easterly zonal winds were anomalously strong leading to an increase in the sea level (and heat content) in the Western sector of the equatorial Atlantic. In the boreal spring-summer 1997 zonal easterly winds relaxed and sea level have readjusted transferring heat zonally towards the eastern section making next fall-winter 1997 season anomalously warm in the Gulf of Guinea with weak easterly winds, characterising an Atlantic “El Niño”. Differently from others warm events reported (Arnault & Cheney, 1994), the present one seems to occur simultaneously to an “El Niño” event in the Pacific (e.g. NOAA, 1998), running against the hypothesis that the equatorial Atlantic response is delayed by one year relative to Pacific events. Although the 5.5 years period is not long enough to evaluate the decadal variability, some indication of it should be present. A 10 years dipole pattern, however, is not observed in the T/P SLA in the present analysis. In the whole tropical Atlantic region considered an oscillating (2 to 4 years) positive trend is observed instead (Fig. 3).The trend estimated in the SLA for the region, however, have to be seen with caution. It can be linked to variability of time scales not resolved by the current T/P data and even linked to drifts in the altimeter measurement system (Nerem et al., 1997).
5. Conclusions
The analysis of the interannual variability of SLA from T/P altimetry for the period October/1992 to March/1998 in the tropical Atlantic ocean ( 15o N-15o S; 060o W-020o E ) through EOF analysis has revealed an occurrence of an “Warm Event” in the Gulf of Guinea in 1997, simultaneously to a Pacific warm event “El Niño”. The North-South dipole pattern with decadal scales signature does not seem to be present in the current analysis of SLA.A sea level trend of 0.30 ? 0.06 cm/y was estimated for the considered region for the period October/1992 to March/1998 from T/P altimetry.
6. Acknowledgements
We are thankful to the French space agency CNES (Centre National d'Etudes Spatiales) through the AVISO (Arquivage, Validation et Interprétation des données des Satellites Oceanographiques) for making available for analysis the TOPEX/POSEIDON data.
7. References
Arnault, S. & Cheney, R. E.1994. Tropical Atlantic sea level variability from Geosat (1985-1989). J. Geophys. Res., 99(C9):18207-18223.
AVISO. 1996a. User Handbook for Merged TOPEX/POSEIDON Products. AVI-NT-02-101-CN, Edition 3.0 .
AVISO. 1996b. User Handbook: TOPEX/POSEIDON Update Product. AVI-NT-02-102-CN,
Edition 1.0.).
Carton, J. A. & Huang. B. (1994). Warm events in the tropical
Atlantic. J. Phys. Oceanogr., 24: 888-903.
Carton, J. A.; Cao, X.; Giese, B. S. & Silva, A. da 1996. Decadal and interannual SST variability in the Tropical Atlantic Ocean. J. Phys. Oceanogr., 26: 1165-1175.
Fu, L.-L.; Christensen, E. J.; Yamarone, C.; Lefebvre, M.; Menard, Y.; Dorrer, M. & Escudier, P.. 1994. TOPEX/POSEIDON Mission Overview. J. Geophys. Res. 99(C12): 24369-24381.
Liebelt, P. B. 1967. An introduction to optimal estimation. Addison Wesley, Reading, MA. 273p.
Nerem, R. S.; Haines, B. J.; Hendricks, J.; Minster; J. F.; Mitchum, G. T. & White, W. B. 1997. Improved determination of global mean sea level variations using TOPEX/POSEIDON altimeter data. J. Geophys. Res. , 24(11): 1331-1334.
NOAA, 1998. National Oceanic and Atmophere Administration Laboratory for Satellite Altimetry. http://ibis.grdl.noaa.gov/SAT.
Preisendorfer, R. W. 1988. Principal Component Analysis in Meteorology and Oceanography. Developments in Atmospheric Science, 17. Curtis D. Mobley Editor.Elsevier, New York. 425p.
Servain, J. 1998. SST and PWS 1964-1997 over Tropical Atlantic. Research-Quality Product (1964-97). internet: http://www.coaps.fsu.edu/WOCE/SAC/atlantic/.
Servain, J.; Wainer, I. & Dessier, A. 1998. Évidence
d'une liaison entre les deux principaux modes devariabilité climatique
interannuelle de l'Atlantique tropical. C.R.Acad.Sci.Paris, Sciences de
la terre et desplanètes, 327: 1-8.